 Sunlight at a glance, is just that, light. But science teaches us early on how critical it is to look at things in different ways to truly understand them. Take a look at that same light through a prism, and dispersion allows us to see the full spectrum of 7 colors that make up that light.
Applying this lesson—that you have to analyze the components of something to fully understand it—is valuable everywhere, including your sales pipeline.
7 Ways to Get a Full View of Your Sales Pipeline
1. Recognize your pipeline is not your forecast
While these are highly related, separating pipeline management from your forecasting practices is important as they serve distinct purposes.
- Managing your sales pipeline is about understanding what your reps and buyers are doing today and planning the steps needed to move them forward.
- Forecasting (while dependent on the accuracy of your pipeline) is about predicting what’s going to happen in the future.
2. Ingrain your defined sales process
CSO Insights reports that mapping your sales process in a formalized way yields a significant increase in reps attaining quota. Arming your reps—and their managers—with a clear picture of what it takes to win deals helps with speeding onboarding, keeping reps focused and helping managers to guide reps on how to move deals forward.
3. Visualize the health of your pipeline
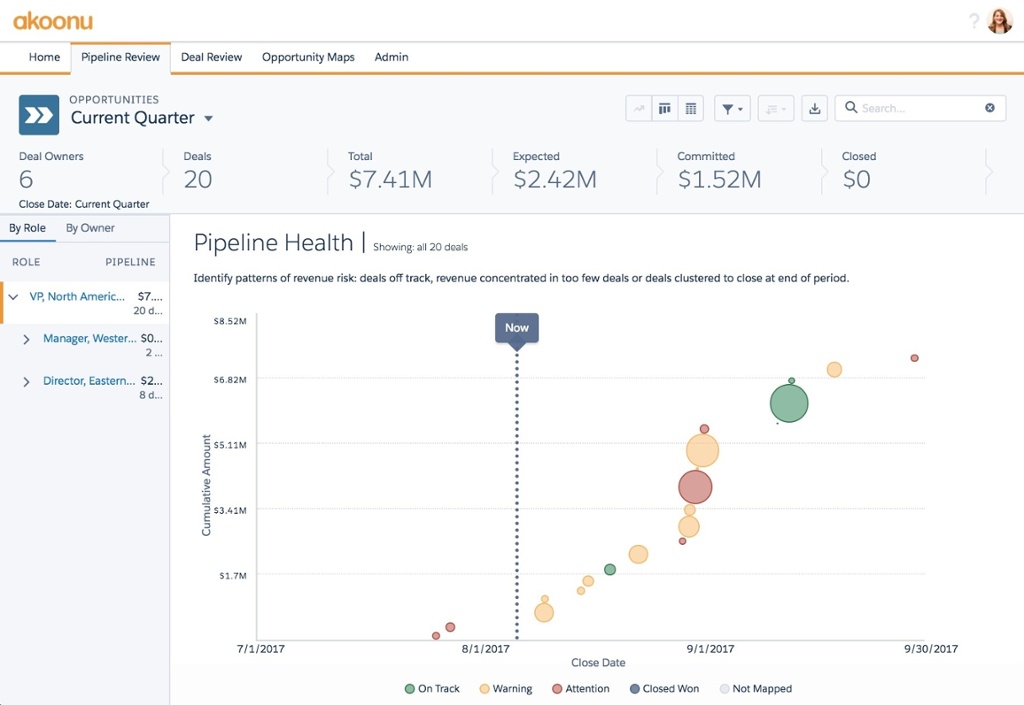
You need quick facts about pipeline risk. Having a visual to help you understand which deals are at risk, when too much revenue is concentrated in too few deals or when there are risks in timing. Akoonu uses this pipeline health view in Salesforce (in our native Salesforce App) to accomplish just that. Notice how the colors indicate which deals are in good health, need attention or are at risk and how the size of each circle represents the proportionate amount of each deal. Deals stacked up at the same time indicate you may have timing risk or the possibility of too few resources to close deals all at the same time. And, large open spaces will tell you that you may be heading for a dry spell.

4. Understand the flow of your pipeline
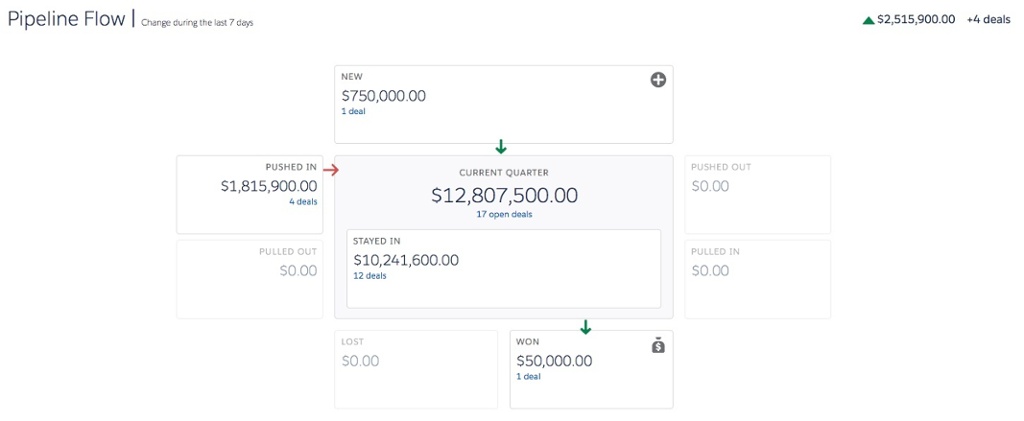
Reviewing your pipeline flow—a representation of how deals in your pipeline have moved in a given period of time—is a great way to understand pipeline value changes, but also the behaviors of deals and reps. Have deals slipped? Been pushed in or out? Increased or decreased in value? Having a single chart to capture these changes can save hours of data analysis.

5. Evaluate deals at a glance.
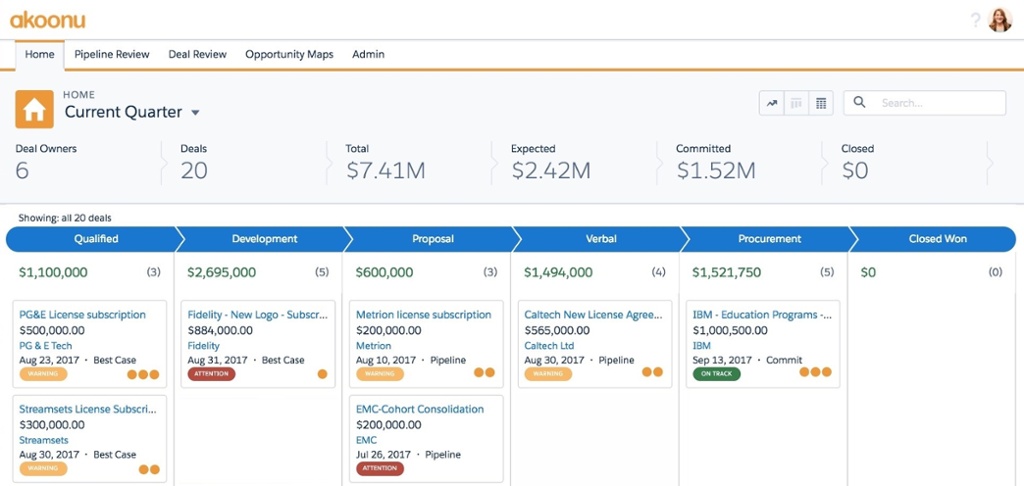
To effectively manage your reps, you need to understand the status of all their deals, and how they stack up in the sales process. Using a deal card, or Kanban, view, you can see each deal with added context including:
- How far along is the deal
- How recently the buyers have interacted (using orange dots to indicate buyer activity)
- The overall health of the deal with Key Status Indicators based on the most common reasons deals go off track
- How long deals have been in a given stage

6. Reviewing your list
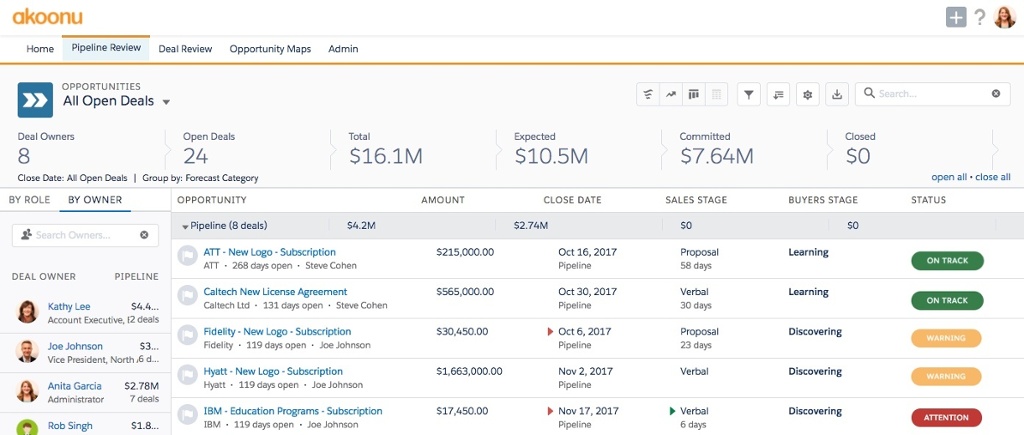
The most common way to look at your pipeline is as a detailed list, but with the technology available today, there’s no reason to live in static spreadsheets. See this list which has the deal status, change indicators and buyer engagement built in, plus the ability to slice and dice your data through filters, groupings, deal types, etc.

7. Pivot by rep, role or territory
Lastly, you’ll want to look at all these types of views with different filters. Start with understanding how the whole team is doing, but drill into each territory, role or rep within these views to get a clear picture of how each rep or team is contributing to your pipeline.

